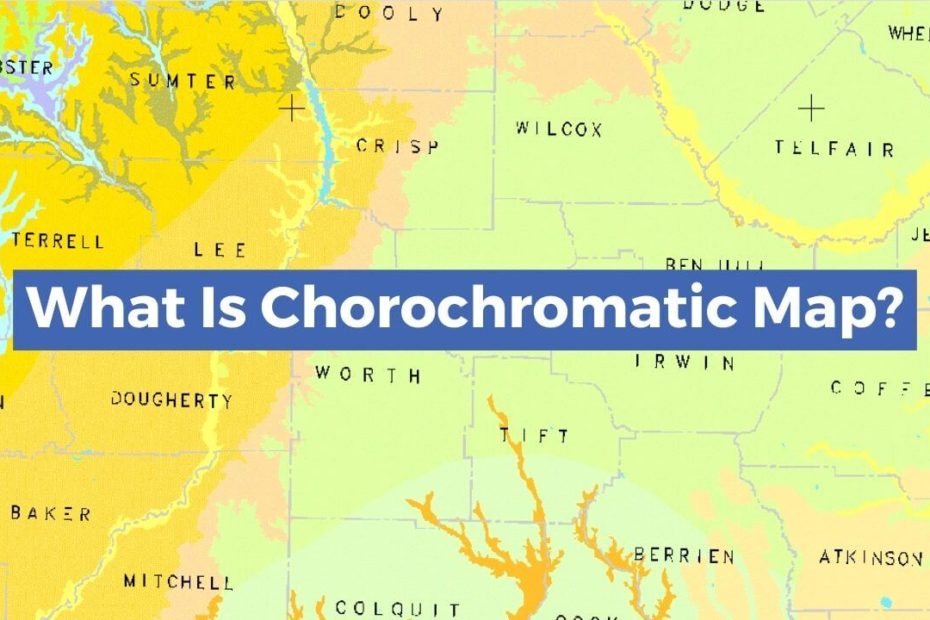
Recently I have been covering techniques used to show symbols, features on map, and one of the techniques I will be looking at today is Chorochromatic Map Technique.
What Is A Chorochromatic Map?
It Is a type of thematic map that portrays regions of categorical or nominal data using variations in color symbols.
A chorochromatic map is a way to visualize our world in new and interesting ways. It’s great for researchers who are looking for patterns or anomalies in the data they’re looking at. In addition, it’s also great for marketers because it can be used to illustrate different demographics, lifestyles, trends and more.
What Is Chorochromatic Technique?
Chorochromatic technique is a color theory from the 18th century that was pioneered by Gottfried Hensel. The Chorochromatic technique was made famous by Heinrich Berghaus, His Thematic Atlas was published in 1837. He created color theory as a way of using colors to create depth and mood in illustrations which includes various topics of Human & Physical geography.
What Are The Uses Of Chorochromatic Maps?
The purpose of the Chorochromatic map is to identify and differentiate the different regions of a map based on colors.The map can be used for many different purposes, but it is most commonly used in geography studies.
The Chorochromatic maps have been widely popularized by cartographers since the first publication of the choropleth technique back in 1878. It has been applied to many geographical applications including population density, electoral divisions, and natural resource distribution.
Chorochromatic Map Categories
Chorochromatic Maps can be categories in two :
- Simple Chorochromatic Map.
Simple Chorochromatic Map used to show single regions where we have some gaps between regions. For example, We can show Forest Area or Coal Mine using a Single Chorochromatic Map.
In this Map Single Colour is used without subdividing it in subgroups.
- Compound Chorochromatic Maps.
Compound Chorochromatic Maps used to show a set of regions with different categories. For Example, Compound Chorochromatic Maps are used to show Vegetation, Soil or Rocks.
In this map different shades or patterns are used.
Chorochromatic Map Advantages And Disadvantages
The chorochromatic map has many advantages and disadvantages which should not be overlooked before making a final decision.
First chorochromatic map advantage is it can be used to show various elements together in a single map.
It can be a good color-based system for categorizing countries or regions. However, the map is highly subjective because it is based on an arbitrary decision about what colors to use.
Some of the benefits of chorochromatic maps include that they are visually pleasing, they are easy to create with the help of software, and they can be used in education to teach geography.
However, one downside of this type of map is that it is based on arbitrary decisions about what colors to use.
Some Of The Categories Where Chorochromatic Maps Are Used
Chorochromatic maps are used in a variety of fields, such as Physical & Human Geography. They can be used to provide insight for solving problems within these fields.
The following categories are where Chorochromatic Maps are typically applied:
- Land Use, Land Cover & Ecozones.
- City Wise Zoning.
- Soil Type.
- Climate.
- Religion and Cultural Trait.
In conclusion, the chorochromatic map has some disadvantages as well as advantages but it is still a good tool for understanding how genetics influence eye color inheritance.
